
Insights & statistics
See what every visit is worth, from the bay to the bar.
Sweetspot Insights is the analytics layer of the AI business platform for golf. It reads everything you run on Sweetspot on one player account and turns it into concrete moves on pricing, booking rules and offers.
What it reads
Every number, in its context.
The platform already runs your bookings, play and sales. Insights put them side by side, which is where the answers are.
Bookings and fill rate
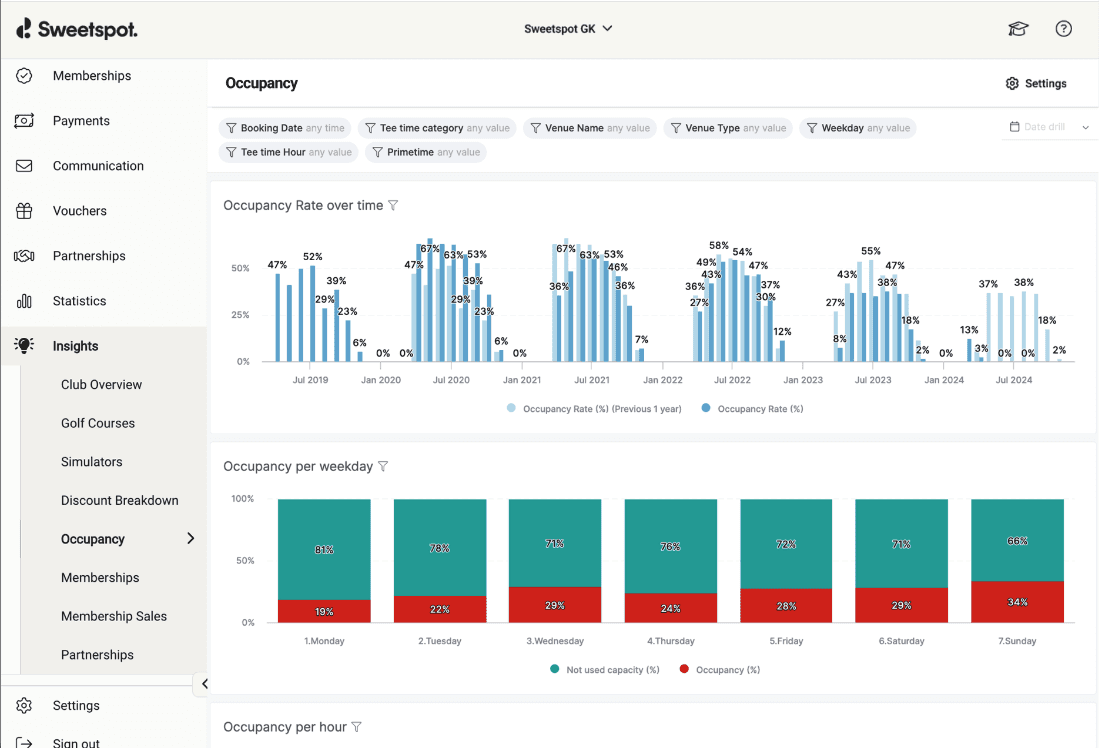
Occupancy per hour, day and bay, so peak and quiet hours are facts, not feelings.
Play activity
Where and when the golf actually happens, from the tee sheet to the range.
Sales and revenue
Green fees, passes and POS sales in one view, connected to the play behind them.
AI on top
Ask a question in plain words and get the numbers behind the answer.
The revenue review
We find money in your numbers.
A review reads a season of activity and pricing, then returns concrete actions and what they are worth. The figures below show what one looks like.
Where and when
Where the demand lives.
One week of occupancy, and a season of balls hit per bay. Peak evenings and the covered first row carry it, which is what pricing and booking rules stand on.
Ask, don’t dig
The feed that reads it for you.
Insights surface what changed and what it is worth, before anyone thinks to ask.

